Why Invest in Early-Stage Startups
Why Invest in Early-Stage Startups

There are many rule of thumbs in the industry but none of them provide a clear view of why we spend an inordinate amount of time looking for that one startup that will return the fund.
Because I prefer charts over rule of thumbs, I built a cap table model based on a few assumptions and data from PitchBook and Cooley GO Trends.
Assume the following:
Outcome: $5b IPO
$ Raised: $611m
# Rounds: 9 rounds
Time: 11 years
This would be the result:
Amount Invested to Realization
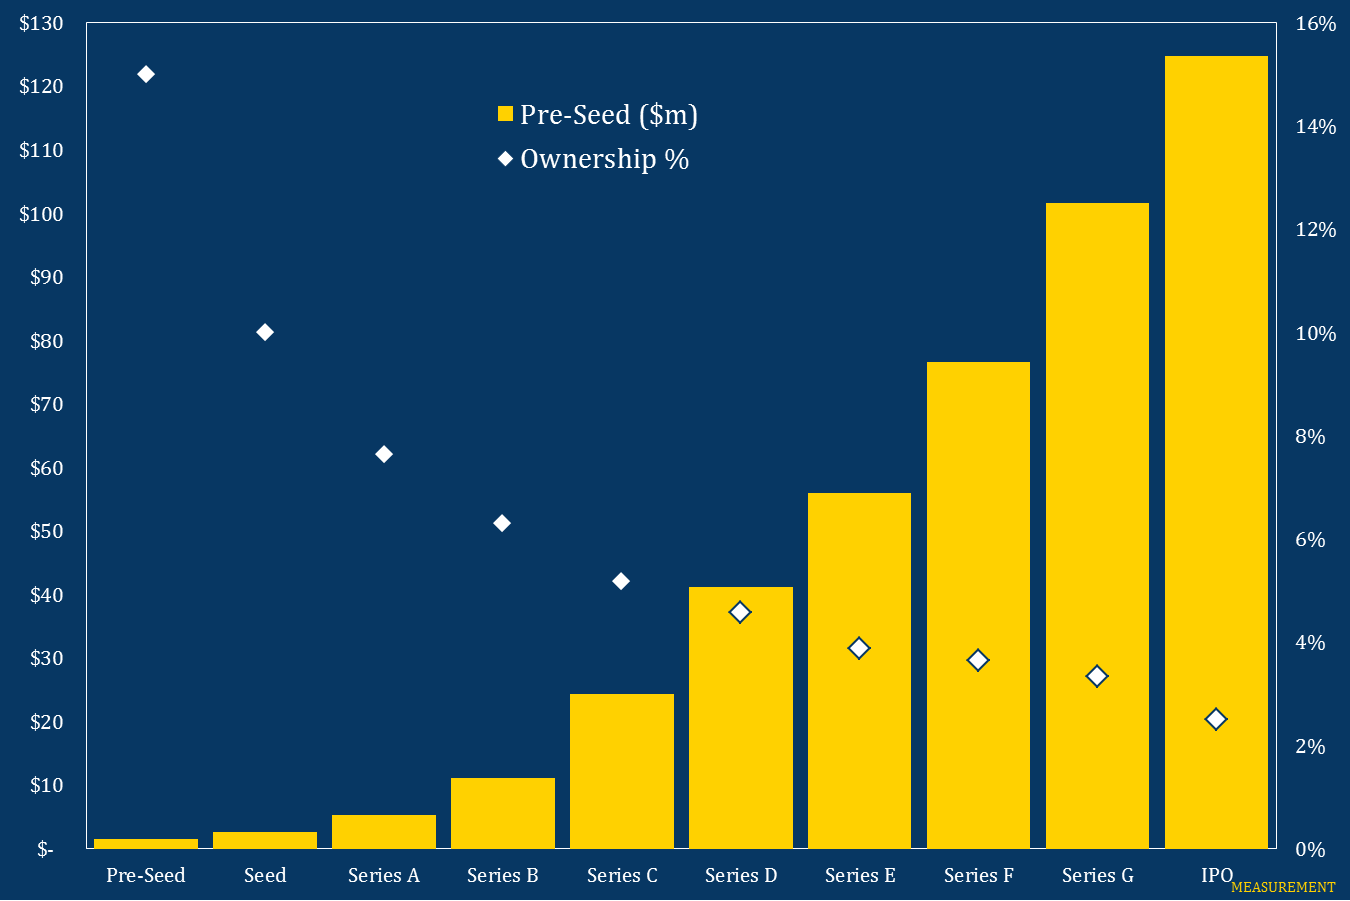
Pre-Seed: $2m -> $125m
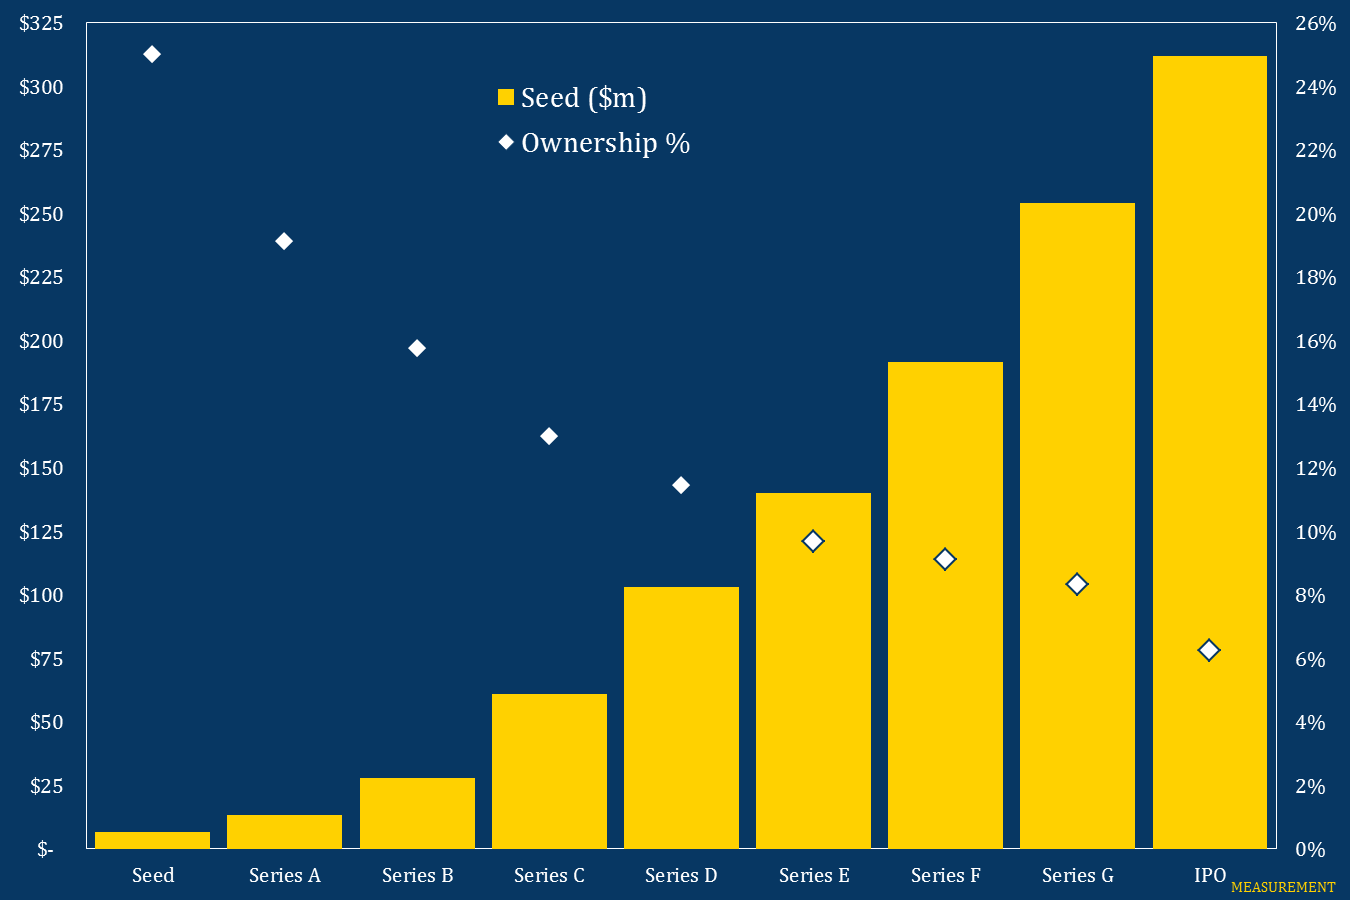
Seed: $7m -> $312m
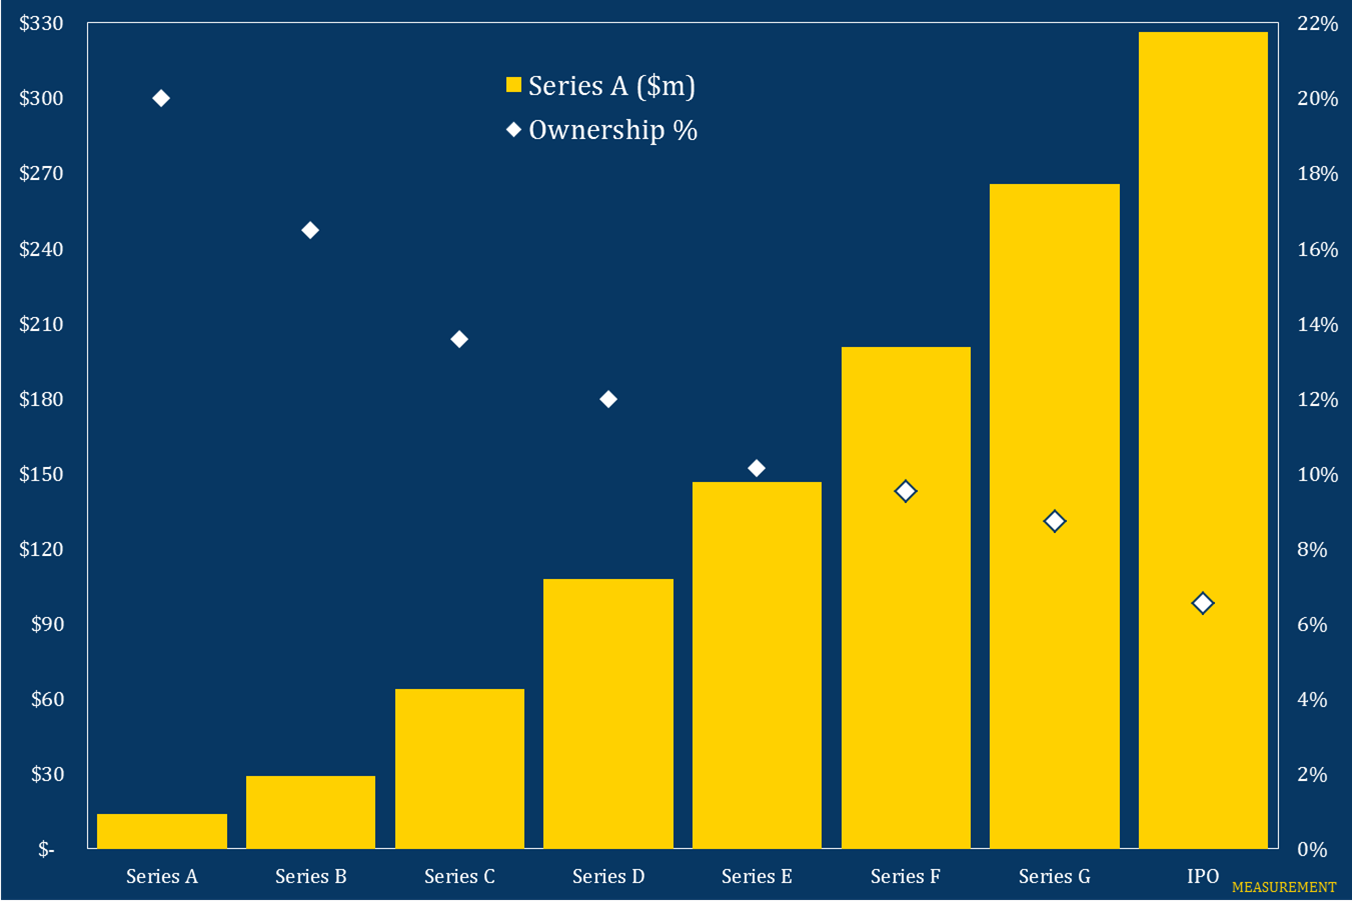
Series A: $14m -> $327m
Ownership from Investment to IPO
Pre-Seed: 15.0% -> 2.5%
Seed: 25.0% -> 6.2%
Series A: 20.0% -> 6.5%
Gross Multiple
Pre-Seed: 83x
Seed: 47x
Series A: 24x
Gross IRR
Pre-Seed: 49.4%
Seed: 49.9%
Series A: 48.5%
But it's the founders who do well in the end.